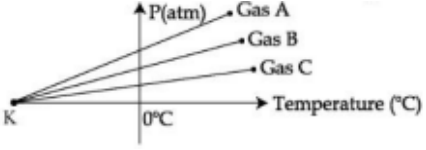
For three low density gases \( A, B, C \) pressure versus temperature graphs are plotted while keeping them at constant volume, as shown in the figure:The temperature corresponding to the point ‘\( K \)’ is:
\( -100^\circ \text{C} \)
\( -373^\circ \text{C} \)
\( -273^\circ \text{C} \)
\( -40^\circ \text{C} \)