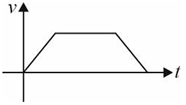
The velocity \( (v) \) – Distance \( (x) \) graph is shown in figure. Which graph represents acceleration \( (a) \) versus distance \( (x) \) variation of this system.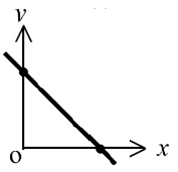
A car moving on a straight road with constant velocity \( 72 \, \text{km/hr} \) sees an old lady crossing the road at \( 42 \, \text{m} \) ahead of the car. If reaction time (time lag between information received and action taken) of car driver is \( 0.1 \, \text{sec} \). Find minimum retardation (in \( \text{m/s}^2 \)) of car so as to avoid accident: