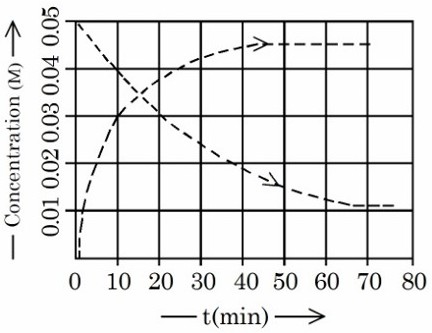
Given above is the concentration vs time plot for a dissociation reaction: \( \mathrm{A} \rightarrow n\mathrm{B} \). Based on the data of the initial phase of the reaction (initial \( 10 \, \text{min} \)), the value of \( n \) is______.
\( 3 \)
\( 2 \)
\( 5 \)
\( 4 \)